In RBS a beam of accelerated ions, typically He or H, impinge on the sample to be analyzed. During the bombardment a minute amount of ions will backscatter from nuclei on and beneath the surface, and some of them will escape from the sample. The combination and interplay of three basic concepts allow RBS analysis to perceive masses and mass ratios (composition) as a function of depth.
The first concept is based upon elastic collisions of ions with the target nuclei, causing the ions to backscatter and carry information about the mass of the atom they backscattered from. The second concept is the probability of backscattering from different elements, which is highly predictable and proportional to the square of the atomic number, allowing the determination of sample composition. The third concept is depth analysis, which is possible because backscattered ions are slowed due to inelastic energy losses before reaching the surface, which can conceptually be understood as "friction" and be treated as a continuous process.
Another powerful characteristic of RBS is the phenomena known as channeling. The backscattering probability is lowered dramatically if the impinging ions are lined up with a crystal axis. This can be visualized by comparing the ions to bullets shot into a tube. They can travel a long way until hitting the sides of the "tube". The more defects there are in the crystal lattice, the more ions will be backscattered, therefore carrying information about defect concentrations. For compositional analysis as a function of depth channeling is usually avoided, and the sample is purposely oriented off axis to give the highest obtainable yield of backscattered ions. When crystal quality information is desired, channeling and non-channeling spectra are superimposed and information can be obtained on where defects are located as a function of depth, like on interfaces.
Although RBS is less destructive than Auger depth profiling (which destroys the film completely) it should be mentioned that the energetic ions cause defect formation and are implanted into the sample (doping). Ion implantation is a widely used technique in semiconductor doping.
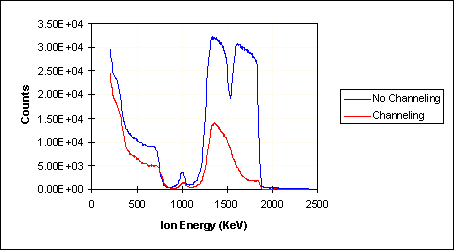
Rutherford backscattering (Ref. 49, U of M IBA) was performed on one GaN sample grown on a-plane sapphire as shown in Figure 43. The sample consists of an AlN initiation layer, a GaN buffer layer, followed by an AlN marker layer, and a GaN layer on top. As can be seen in the figure, crystal quality degrades toward the sapphire interface as well as at the AlN interface due to the lattice mismatch to GaN. Ion channeling measurements were also performed as shown in the same figure. Channeling versus nonchanneling intensity is about 10-20% on the surface, compared to about 3% for high quality GaAs. More detailed studies are planned to investigate GaN and AlN crystal quality using RBS.
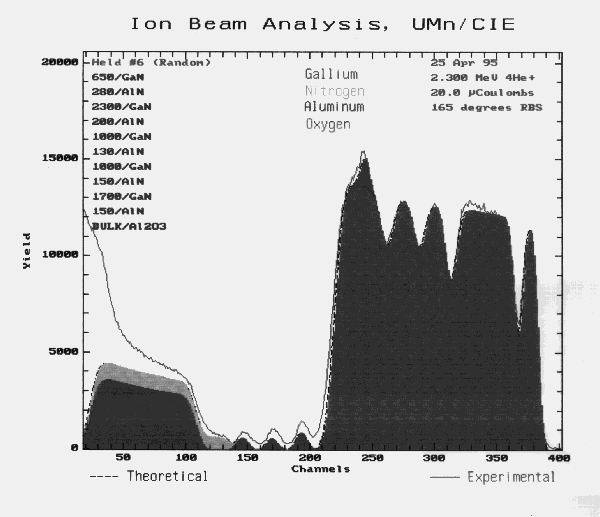
An example using RBS for depth profiling is shown in Figure 44. As can be seen in the figure, alternating layers of AlN and GaN were deposited (4 AlN, 5 GaN). This shows the potential of RBS as a non-destructive and quick depth profiler compared to Auger Depth Profiling. The layer thicknesses are obtained by fitting a theoretical curve to them deconvolving overlapping peaks. Note the first Al peak overlapping with the last Ga peak.

Figure 43: RBS Channeling versus Nonchanneling (Ref. 49, U of M IBA).
GaN on AlN marker layer on GaN buffer layer on AlN initiation layer on a-plane sapphire substrate. Note that the edge of the N surface peak happens to coincide with the Al peak from the AlN initiation layer.

Figure 44: Typical Depth Profile using RBS. Multiply layer thicknesses given by 1.71 (GaN) and 1.65 (AlN) to correct for wrong densities used for the curve fit (Ref. 49, U of M IBA).
Table of Contents