Further evidence that the growth rate is lower above the balance point than at the balance point was obtained from several samples by looking at the thickness fringes caused by different growth rates, as well as supporting evidence obtained from profiler scans to estimate sample thickness by taking advantage of the regions covered by the clips holding the sample to the sample holder (see section on sample holders).
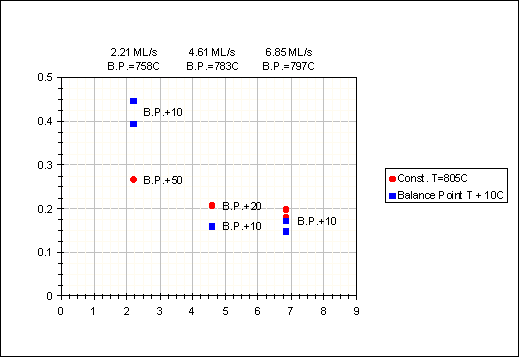
Last minute results were obtained from 2 superlattices, whose layer thicknesses were measured using Rutherford Backscattering (RBS). The first sample was grown at constant NH_3 flux (leak valve: 5x10^-6 torr) and constant substrate temperature, while the variable was the Ga flux as shown in Figure 40. A second sample was grown at the same Ga fluxes as the first sample and constant NH_3 flux as well, but close to the balance point (10° above), also shown in Figure 40.
The RBS results were somewhat unexpected. First, the growth rate seems to increase with decreasing Ga flux, all other parameters kept constant. Second, the growth rate at balance points seems to be quite a bit larger at low Ga fluxes (2.21 ML/s GaAs), while at higher Ga fluxes the growth rate stayed constant as expected from the model. As can also be seen from the figure, keeping the Ga and NH_3 flux constant while raising the substrate temperature causes the growth rate to drop as expected. The data point 20° above the balance point (Ga flux = 4.61 ML/s GaAs) experienced a slightly higher growth rate though, and it should be mentioned, as also discussed in the section on RHEED beam effects, that growth rates slightly above the balance point might be slightly larger.
These results should not be taken at face value yet though. The growth rates were obtained by manual fitting to the RBS scans. It was difficult to get accurate data because of significant interdiffusion between AlN and GaN layers. Most AlN layers were grown for the same time at the same condition, and while the first sample showed AlN layers of equal thicknesses, the AlN layers seemed to vary quite a bit in the second sample. This indicates that the fitting method used was probably not very accurate on the second sample.
As a comparison to the RBS results the same samples are currently being submitted for Auger Depth Profiling, and no results are available yet. These results will be compared with the RBS results and based on these results new experiments are planned to further study the growth rates in more detail. It is also being suggested to use thinner AlN marker layers to simplify RBS analysis. AlN marker layers of 50 Å should be sufficient, especially when the film thicknesses are adjusted so that the peaks stand alone between the N and Ga peaks. This is much easier to analyze, since AlN layer thickness can then be neglected and GaN film thicknesses can be obtained from both the Al and Ga peaks, giving two sets of data that should agree.
It should also be mentioned that the AlN growth rate is approximately 0.1 um/h at an Al flux of 0.3 ML/s (AlAs), NH_3 flux (leak valve) of 5x10^-6 torr, and a substrate temperature of 880°C.

Figure 40: Growth Rate Results using Rutherford Backscattering (RBS)
Table of Contents