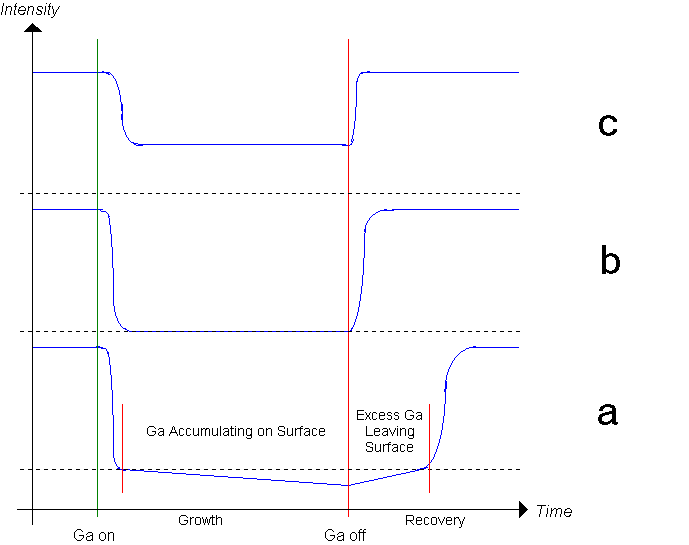
A good way to visualize what happens to the RHEED pattern when Ga starts accumulating on the sample surface is to consider a perfect GaN surface under Ga flux (no ammonia flux), at a substrate temperature that is low enough so that the desorbing Ga Flux is less than the incoming Ga flux (see figure 1a).
Under these conditions the first layer of Ga starts building up, trying to maintain the periodicity of the underlying GaN lattice. The Ga molecules though move quickly between preferential sites due to their high mobility at the substrate temperatures used. During the buildup of the first layer the intensity of the RHEED pattern drops sharply until the whole surface is covered by 1 monolayer of Ga. The remaining RHEED pattern intensity is due to Ga atoms residing longer at preferential sites dictated by the underlying crystalline GaN than in-between. In addition, the RHEED beam probes to some extend beyond the Ga layer and still sees some of the underlying crystalline GaN.
Subsequent layers of Ga will be progressively disordered approaching the random ever changing arrangement of the liquid state. This causes the weak remaining RHEED pattern to further decrease in intensity until the RHEED beam fails to see any periodicity dictated by the underlying crystalline GaN, and the GaN itself.
The substrate temperature at which the desorbing Ga flux just equals the incoming Ga flux (see figure 1b) will be termed the 'balance point'. By finding this condition for several Ga fluxes and by utilizing the vapor pressure equation for Ga we are able to calibrate our substrate temperature over a wide range.

Figure 1a: If the substrate temperature is to low for a given Ga flux, Ga starts accumulating on the GaN surface. The RHEED pattern intensity drops sharply to a level indicating full one monolayer Ga coverage of the GaN surface and then continues to degrade. When closing the Ga shutter the excess Ga desorbs from the surface until the intensity level indicating one monolayer Ga coverage is reached, after which the intensity rises quickly to the level indicating that all excess Ga left exposing the single crystalline GaN surface.
Figure 1b: If the substrate temperature is adjusted in such a way that the surface is always fully covered by 1 monolayer of Ga, then the incoming flux just equals the outgoing flux. In this situation the intensity drops to a level that indicates complete 1 monolayer Ga coverage of the surface. This situation will be called the 'balance point'. Note that every Ga flux has a unique substrate temperature at the balance point, and vise versa.
Figure 1c: If a high enough substrate temperature is chosen so that no Ga builds up on the GaN surface it will only be covered by some fixed fraction of full Ga coverage at any time. In this situation the RHEED pattern intensity decreases upon opening of the Ga shutter by a fixed amount and remaining at that level until the shutter is closed again, rising sharply back to the original level. The smaller the amount of Ga on the surface at any time, disturbing the periodicity of the GaN surface, the smaller the decrease in intensity of the pattern. It is suggested that the initial decrease in RHEED pattern intensity is proportional to the fraction of Ga coverage of the GaN surface.

Figure 2: Typical RHEED intensity data corresponding to figure 1. The noise is due to the RHEED system used.
The substrate temperature can therefore be determined as follows. At the balance point, the equilibrium flux condition is given by:
![]()
Since the vapor pressure condition is also met:
![]()
The incoming flux can be expressed in terms of pressure using kinetic theory as

where p is the pressure from the vapor pressure equation usually written as:
![]()
Since at the balance point
![]()
we can write the balance point condition as:

The incoming flux (Gammain) for the element of interest can be determined by observing the RHEED oscillation frequency during AlAs, GaAs, or InAs growth (source calibration).
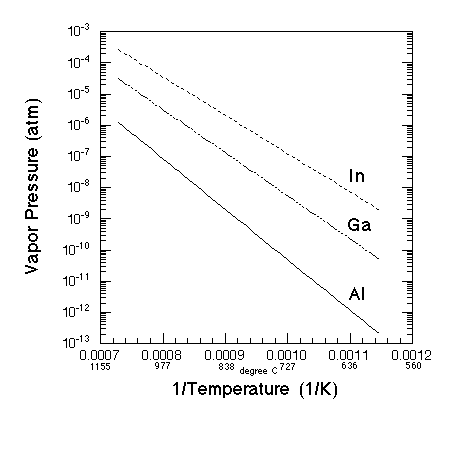
Figure 3: Vapor pressure of Al, Ga, and In as a function of temperature

Figure 4: Balance Points for Al, Ga, and In


Figure 5: Mo sample holder adjustable to square samples from ~0.5'' to ~3x3 mm. Samples are held loosely (force free) in 4 groves at the end of 4 sliders.
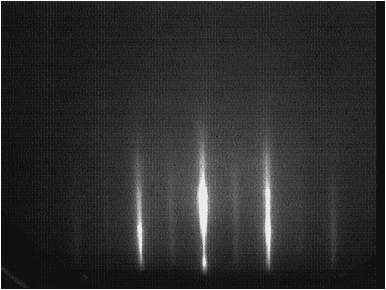

Figure 6: 2-D GaN RHEED pattern at directions 1120 and 1100. Note that the pattern has a 3-D component, but 2-D (streaky) patterns can be and were achieved.
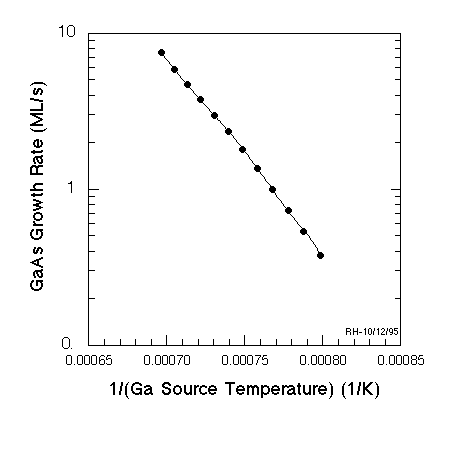
Figure 7: Ga source calibration using GaAs RHEED oscillations (GaAs on GaAs)

Figure 8: In source calibration using InAs oscillations (InAs on GaAs)
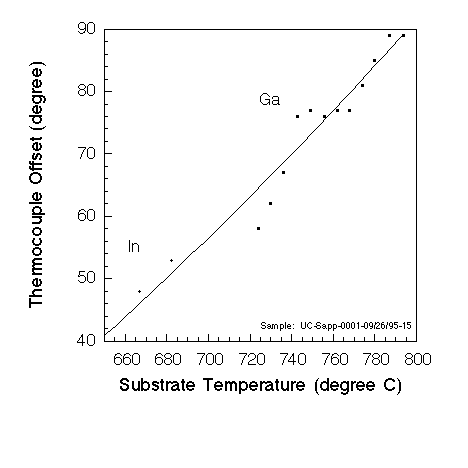
Figure 9: Thermocouple offset as a function of substrate temperature for a particular experiment. Showing validity of balance point method.
Back to my home page